Contents
Note: If you’re not here for the spiel, you can find the full code for the Data Studio Connector on Github.
Way back in 2017 Data Studio was setting the world on fire for digital marketers the world over.
Out went the long and tedious self refreshing Google Sheets, in came the sleek UI, flexible data sources of Google’s Tableau competitor.
Back then one of the more interesting things that it allowed you to do, in a similar (if not identical) way that Google Apps Script provided in Sheets, was to allow you to build your own Community Connector.
This was an attempt on Google’s part to largely outsource the development of things that people would find useful / worth adopting Data Studio for, for packages / data sources that weren’t already baked in or already part of the Google ecosystem.
The majority of people involved in digital marketing at least, are only here to extract insights from Google Analytics, with as minimal configuration or navigating through templates and reports as possible.
One of those use cases, certainly for SEOs is how to import your Ranking data into Data Studio, and since I did this far more robust solutions, such as uploading this information into a data warehouse, and then just getting that from BigQuery or wherever and either visualising it in DS or Tableau or similar.
However, being of limited means this was unfortunately not an option, and largely inspired by Aaron Dicks’ forays into creating one using the Stat API, it was the Connector method that I ended up going down with all the caveats attached of (slow, somewhat flakey).
However, it did do the job (provided nobody asked too much of it, like asking for more than 3 weeks of data). And for the purposes of a beginner introduction to Apps Script / JavaScript in general, I thought it would be quite interesting to go through, if functionally you’d probably be better off using the official Rank Ranger Connector.
So, here, we’ll break down the constituent parts of these things, and avoiding some of the common gotchas.
getConfig()
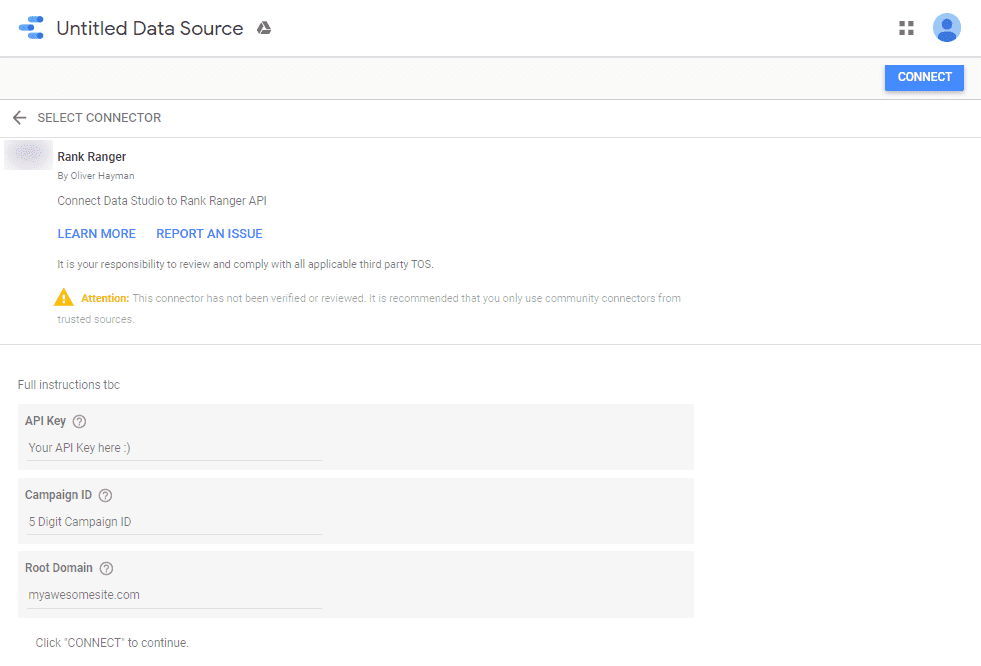
So this essentially defines the screen you see once you’ve selected this connector as a data source. And this is useful if you want to manually input any variables you may need as part of your API request. So here you can see we’re requiring users to input the API key, the Campaign ID, as well the as the root domain that you want to get data on.
Additionally because we’re going to be using the data ranger time filter in our report, we’ll set dateRangeRequired to true.
function getConfig(request) {
  var config = {
    configParams: [
      {
        type: 'TEXTINPUT',
        name: 'apiKey',
        displayName: 'API Key',
        helpText: 'Enter the API Key you get from the Tools > Utilities > API Console',
        placeholder: 'Enter your API Key in here.',
      },
      {
        type: 'TEXTINPUT',
        name: 'campaignId',
        displayName: 'Campaign ID',
        helpText: 'Enter the unique identifier of the website',
        placeholder: 'Add your Campaign ID.',
      },
      {
        type: 'TEXTINPUT',
        name: 'domain',
        displayName: 'Root Domain',
        helpText: 'Enter the root domain of your site.',
        placeholder: 'Enter the root domain of your website.',
      }
    ],
    dateRangeRequired: true
  };
  return config;
}
getSchema()
Here we’re just returning the schema or the data model that you’ll be using for each of your dimensions and metrics. Basically it determines whether your field appears as blue or green when selecting these fields, whether they’re strings or integers, and whether the data can be aggregated or not.
Note: here I’ve just put the schema into a variable called fixedSchema, and am just returning that within the getSchema() function.
var fixedSchema = [
  {
    name: 'Date',
    label: 'Date',
    description: 'Date',
    dataType: 'STRING',
    semantics: {
      conceptType: 'DIMENSION',
      semanticType: 'YEAR_MONTH_DAY',
      semanticGroup: 'DATETIME'
    }
  },
  {
    name: 'Url',
    label: 'Site Domain',
    description: 'Site title',
    dataType: 'STRING',
    semantics: {
      conceptType: 'DIMENSION',
      semanticType: 'TEXT',
      semanticGroup: 'TEXT',
    },
  },
  {
    name: 'LandingPage',
    label: 'Landing Page',
    dataType: 'STRING',
    semantics: {
      conceptType: 'DIMENSION',
      semanticType: 'TEXT',
      semanticGroup: 'TEXT'
    }
  },
  {
    name: 'Keyword',
    label: 'Keyword',
    description: 'Keyword',
    dataType: 'STRING',
    semantics: {
      conceptType: 'DIMENSION',
      semanticType: 'TEXT',
      semanticGroup: 'TEXT',
    },
  },
  {
    name: 'searchEngine',
    label: 'Search Engine',
    description: 'Name of the search engine.',
    dataType: 'STRING',
    semantics: {
      conceptType: 'DIMENSION',
      semanticType: 'TEXT',
      semanticGroup: 'TEXT'
    }
  },
  {
    name: 'searchEngineName',
    label: 'Search Engine Name',
    description: 'Full name of the search engine.',
    dataType: 'STRING',
    semantics: {
      conceptType: 'DIMENSION',
      semanticType: 'TEXT',
      semanticGroup: 'TEXT'
    }
  },
  {
    name: 'Rank',
    label: 'Rank',
    description: 'Keyword ranking position',
    dataType: 'NUMBER',
    semantics: {
      conceptType: 'METRIC',
      semanticType: 'NUMBER',
      semanticGroup: 'NUMERIC',
      isReaggregatable: false
    }
  }
];

function getSchema(request) {
  return { schema: fixedSchema};
};
getData()
Now, after the basic configuration & defining our fields, on to the good bit! The actual calling of data.
The first is a small function that takes the fields from the request object, and then for each field checks is the fixed schema name the same as the field name, and if so adds it to our dataSchema array.
var dataSchema = [];

request.fields.forEach(function(field) {
    for (var i = 0; i < fixedSchema.length; i++) {
      if (fixedSchema[i].name === field.name) {
        dataSchema.push(fixedSchema[i]);
        break;
      }
   }
});
Then we just construct our API url request (sadly it’s not like GA or GSC API where there’s lots of pre-built methods that we can use to call / make requests to the API and pass parameters to) so we’re going to have to do this the old fashioned way and build the request API url manually.
We’ll then construct it using the config variables we defined at the start, so taking in our API key, Campaign ID, and Domain. The start and end date will be handled auto-magically by Data Studio because we set dateRangeRequired to true, so now we can just use startDate and endDate as properties on the request’s dateRange object.
// Build URL
var url = [
  'https://www.rankranger.com/api/v2/?rank&key=',
  request.configParams.apiKey,
  '&start_date=',
  request.dateRange.startDate,
  '&end_date=',
  request.dateRange.endDate,
  '&campaign_id=',
  request.configParams.campaignId,
  '&domain=',
  request.configParams.domain,
  '&output=json'
];

// Fetch the data
var response = UrlFetchApp.fetch(url.join(''));
var parsedResponse = JSON.parse(response.getContentText());
Then we’ll simply mash these individual strings together and use UrlFetchApp.fetch() which just sends a GET request to the API URL in the same way that fetch() would in ordinary JavaScript or requests.get() would in Python.
Then lastly we just get the text response from response and convert it into JSON so that Data Studio can then instead turn it into something useful.
Next, we’ll convert this parsed JSON response data and set about formatting it into a tabular data structure, that we’d more regularly associate with an SQL table or CSV.
For this we’ll build yet another empty array, and then take our parsed response and use the forEach() method (other looping operators like .map() or a regular for in loop are acceptable here) and use the parameter keyword_obj to mimic what will be our newly created object that we’ll end up saving to the data array.
Here inside each keyword object, we’ll then loop over each field (keyword, search vol, rank, URL etc) and ten one by one check what field it is using the switch case statement.
// Prepare the tabular data.
var data = [];
parsedResponse.result.forEach(function(keyword_obj) {
    var values = [];
    dataSchema.forEach(function(field) {
      switch(field.name) {
        case 'Date':
          values.push(keyword_obj.date.replace(/(\d\d)\/(\d\d)\/(\d{4})/, "$3-$1-$2").replace(/-/g,""));
          break;
        case 'Url':
          values.push(keyword_obj.url);
          break;
        case 'LandingPage':
          values.push(keyword_obj.lp);
          break;
        case 'Keyword':
          values.push(keyword_obj.keyword);
          break;
        case 'searchEngine':
          values.push(keyword_obj.se);
          break;
        case 'searchEngineName':
          values.push(keyword_obj.se_name);
          break;
        case 'Rank':
          values.push(keyword_obj.rank);
          break;
        default:
          values.push('');
      }
    });

    data.push({
      values: values
    });
});
Note: the ugly replace() method was used because Data Studio can be a bit funny about how it parses the dates at times (and Rank Ranger uses American dates) so have converted into YYYY-MM-DD to be safe.
And then it’s simply a case of getting the data for each column / field from the keyword_obj and pushing that to our values array.
Once that’s done we’ll take all the data from the values array, push it up to our data array (which is outside of the local function scope / code block).
return {
  schema: dataSchema,
  rows: data
};
And finally, we’ll simply return our dataSchema array as our schema, and our data array as our rows of data.
Deployment
Now to get this sucker up and running, so first things first, head over to Google Sheets, and go to:
Tools > Script EditorThen delete what you’ve got currently, and paste the whole thing into the Code.gs file (and rename it to rank-script.gs or something) and hit save.
App Manifest
The other thing you’ll need to do to publish the script is create a appsscript.json which provides the basic metadata that gets displayed when you’re trying to find your community connector in Data Studio.
So essentially, you’re providing the name of the connector, a logo, a brief description on what it does, and just some additional contact links.
{
  "timeZone": "Europe/London",
  "dependencies": {
  },
  "webapp": {
    "access": "MYSELF",
    "executeAs": "USER_DEPLOYING"
  },
  "runtimeVersion": "V8",
  "dataStudio": {
    "name": "Rank Stats API",
    "logoUrl": "https://www.myawesomesite.com/images/connector-logo.png",
    "company": "Awesome Site Inc.",
    "companyUrl": "https://www.myawesomesite.com/",
    "addonUrl": "https://www.myawesomesite.com/",
    "supportUrl": "https://www.myawesomesite.com/support/",
    "description": "This connector can be used to show your Rank Ranger data in Data Studio."
  }
}
Once you’ve got that, still inside the Script Editor hit:
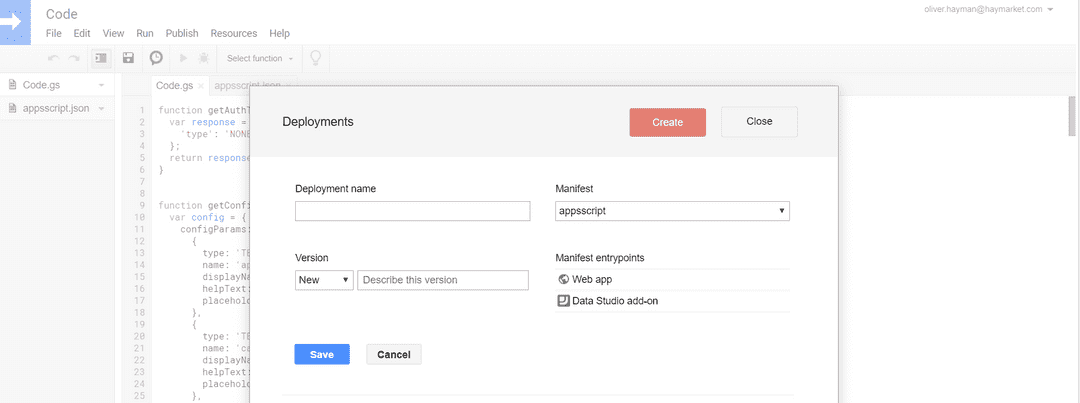
Publish > Deploy from manifest...You should then be greeted with this screen (below), where you just need to give it a Deployment name like “Test Connector 1.0” or something and then hit “Create”. (Or alternatively just use the Latest Version.)
Then hit the Data Studio link that it gives and you should be in business. Once in there you should be into the normal Data Studio data source flow. Hit “Authorize” (we’re not using OAuth here so it should just be automatic).
And then you’ll be presented with three fields to fill in, based on some parameters required for our API request.
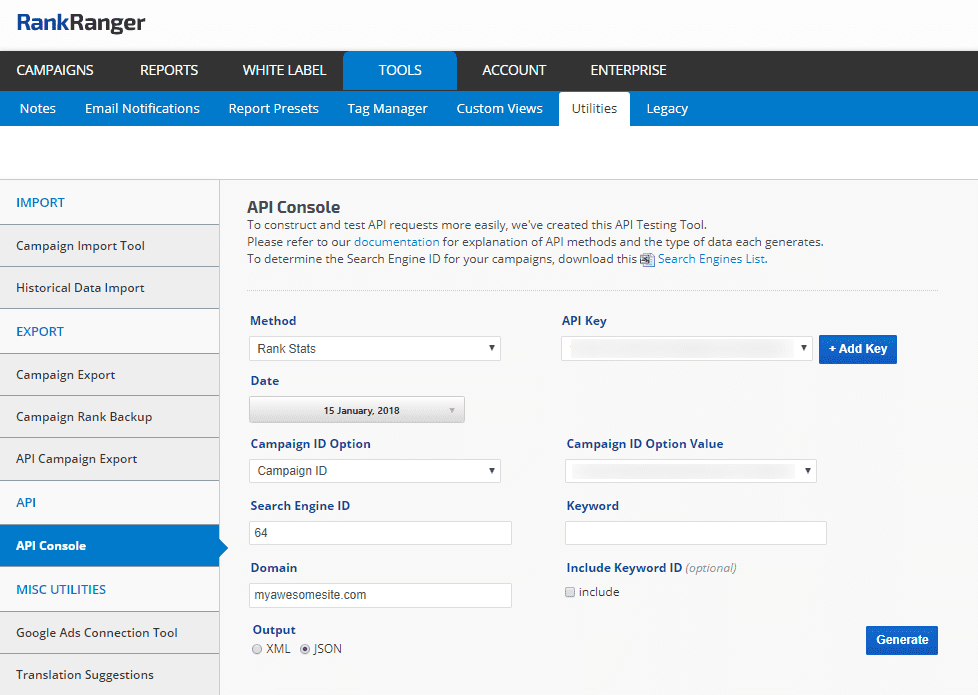
Should you not have these to hand, head over to Rank Ranger’s API Console where you can get access to your credentials, such as your API Key & the Campaign ID, as well as build any test URLs should you wish to test the response, or explore what other API methods are available.
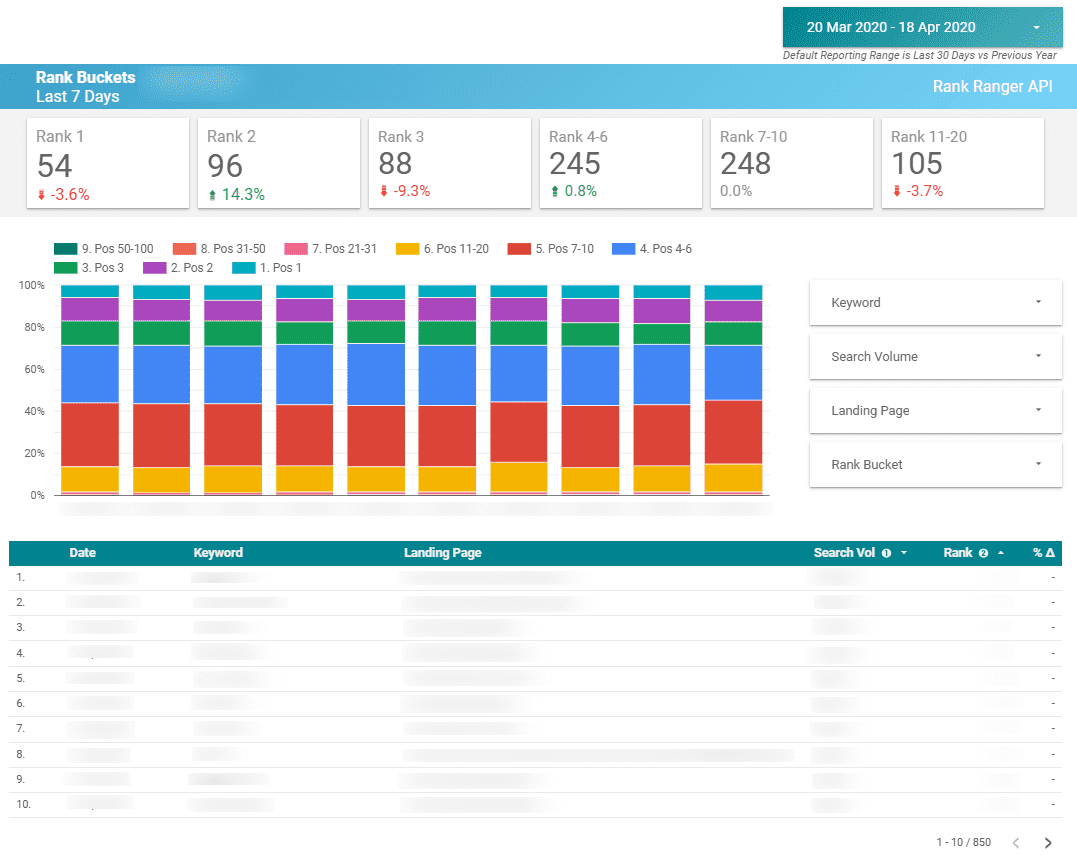
After that you should be free to query the API data in Data Studio as is your want. I would start out by just building a basic table, to see what the bare bones data looks like, and then you can use Custom Dimensions in Data Studio to aggregate that into Rank Buckets or generate other metrics like # Keywords.
And that’s it your very own Data Studio Connector! 🚀
Next steps…
Other things you could look at to improve on this is looking at the performance, i.e. by implementing caching, or, as well, now that the V8 engine has been introduced into Google Apps Script, allowing the use of ES6, would be turning all of our code into asynchronous functions instead.


